Data Handling
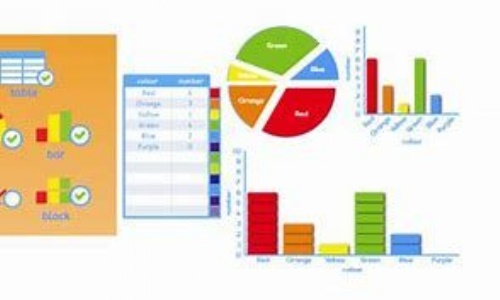
In computing this half term, the children have been using surveys to create tables and bar charts to organise and interpret data more easily. They have looked at the difference between questions which only 2 answers and those which have multiple choices.


They were even able to use the data they collected in science (about birds in the local area) to create bar charts.

Come back soon to see what we do next...
Please enter some content for your blog post here.